If you go to the internet and Google "winter weather 2014-15" you will get dozens and dozens of outlooks for this coming winter. Are any correct? Possibly, but there are so many opinions out there, some not even based on science. I WON'T post the fictitious map that came out about a month ago that was released by a satirical web site and unbelievably was shared millions of times on social networks as if it was a "real" outlook. There were even decision makers ready to jump on it - which is very scary in my opinion.
By the way, you can click on any image in this post for a larger version.


I'm going to go ahead and offer the "official" winter outlook produced and posted by the fine folks at the Climate Prediction Center. If you want to take the time and read their reasoning, then click here. I don't necessarily agree with their assessment as they tend to go with persistence and composite analogs, that rarely verify.
CPC's precipitation outlook for the winter
(December, January, February)
(December, January, February)

CPC's temperature outlook for the winter
(December, January, February)
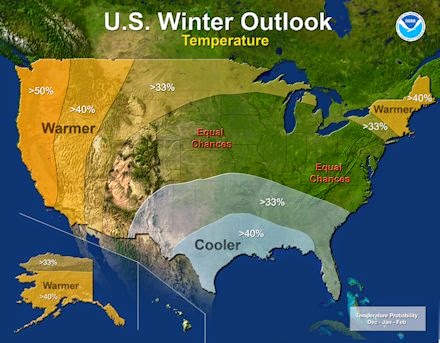
NOTE: On the CPC maps above, the "equal chances" DOES NOT imply normal conditions! It simply means the forecasters did not have enough confidence to state an outcome. Probabilities greater than 33% indicates the direction they (forecasters) were leaning. Example, the >40% in the warmer shaded area is leaning towards above normal temperatures.
A little background on extended outlooks
For the High Plains of Kansas the climate is characterized by highly variable conditions, both in short and long time periods. The proximity to the Rocky Mountains and the Gulf of Mexico moisture source are just two of the reasons for such variability. But it is much more complicated than that. There are numerous intra-seasonal, multi-seasonal, multi-year, multi-decade and even multi-century ocean/atmosphere cycles that have influences on our weather.
Interactions with land masses, oceans and the sun are what drives our weather. Understanding these interactions can help (or hurt) long range forecasts. Because of millions and millions of interactions across the globe and the fluctuation of the suns energy, forecasts beyond just a few days can suffer in accuracy. So, ANY seasonal outlook can be WAY off! The following are just a few of the tele-connection cycles and oscillations that impact our weather (and feel free to Google these for an explanation of each):
The Madden Julian Oscillation (MJO)
Global Wind Oscillation (GWO)
El Niño/La Niña - Southern Oscillation (ENSO)
North Atlantic Oscillation (NAO)
Arctic Oscillation (AO)
Pacific Decadal Oscillation (PDO)
Atlantic Multdecadal Oscillation (AMO)
Solar cycles (this could be a HUGE player in the next couple of decades)
A friend of mine from back in my college days at the University of Oklahoma (BOOMER) and I had many, many discussions about the weather and apparent cycling of weather patterns. He was originally from southern California where it hardly EVER rained and just the sight of a cloud got him excited about weather. Through observations, it became apparent that even though weather systems moving around the globe were mostly transitory and often chaotic, there was a subtle observation that weather patterns would repeat throughout the year. In other words, the jet stream would show very similar behaviors on a specific time scale. This cycle length appeared to vary from year to the next.
The cycling pattern
It is complicated and I'm not going to try and convince anyone that this cycling pattern does exist during the year. During the northern hemisphere Fall the jet stream (band of westerly winds aloft) will increase in velocity and traverse from a higher to lower latitude or vice versa. The jet stream winds occasionally amplify into a north/south fashion which is an unstable position for this wind energy to be in. At some point the jet stream will "snap" back into place (west to east) and starts a sinusoidal rhythm. Once this first rhythm begins, it will eventually repeat and then continues to do so until the velocity of the wind decreases during the late northern hemispheric summer months. This cycling pattern of the winds aloft and the behavior is similar from one cycle to the next. The cycle length can vary considerably from one year to the next though (on the order of 25 to 60 days). Last year (fall of 2013 though the late summer of 2014) the length was about 57 days, give or take (it's not always exact).
The tele-connection cycles and oscillations (MJO, GWO, ENSO, NAO, AO, PDO, AMO) that I mentioned above can enhance or even work against this cycling pattern. In my opinion, some of these may also help to get the pattern started. Again, it's complicated.
So, the trick is trying to figure out the cycle length and how these other tele-connection cycles and oscillations will impact the flow above us. Unfortunately, this cycle length cannot be computed until the first cycle is completed and starts to repeat. If it's a long cycle, it may not be until late November before I know. Ugh.
At this point in time, I can only offer a look into some of the indices or background forcing that may be a contributor in the pattern.
The Arctic Oscillation changes quite a bit during the year. The chart below is just a forecast from long range computer models and is not the gospel truth. However, the outlook has been consistent in that the index is forecast to be negative through much of January. A negative phase of the AO (indices below zero) would support Arctic air intrusions into the U.S.

The North Atlantic Oscillation is forecast (again by long range models that may not be entirely accurate) to be near normal to slightly below. A negative phase of the NAO (indices below zero) indicates a "blocking" Atlantic pattern which would favor systems slowing down and maybe hanging around a bit longer than normal.

The upshot of the two above (AO and NAO) is that IF the guidance is close to being correct, there could be the potential for several Arctic intrusions that would last more than a few days.
The Madden Julian Oscillation (MJO) has not been robust yet, but could be a player in the weather later this winter. Again, you can Google any of these indices to get a better understanding. The MJO is a 30 to 45 day pattern oscillation that originates in the western Pacific near the Indian Ocean or Maritime Continents.

There has been much talk about an El Nino developing this fall and winter and some talk of it being exceedingly strong. A strong El Nino would definitely impact southern California and east across the southern tier states. I think this is a basis for the CPC forecast. However, an El Nino has NOT formed yet and is struggling to get going. Everyone should root for one as this would help alleviate the extremely bad drought that is on-going across California. The chart below shows the Southern Oscillation Index (SOI) which is a measure of the pressure differences between Tahiti and Darwin, Australia. A significantly negative value for an extended period indicates El Nino conditions.


Perhaps more importantly is the above normal temperatures across the north Pacific, tied to the Pacific Decadal Oscillation. That might be a big player this year if it helps pump up the jet stream into the Arctic or higher latitudes. It will be something to watch. Also, the temperature profile across the Pacific basis is favorable for the sub-tropical jet stream (winds across the lower latitudes) to become a play maker this winter. That would provide tropical moisture into the U.S. and help lower surface pressures across the southern plains. Upshot of this would be an increased chance for above normal precipitation there. We've already seen a significant occurrence of systems moving into the southwest U.S. since late summer and it'll be interesting to see if that trend continues.
Finally, the Outlook
First I want to show you some solutions from one of the long range forecast models. Agreed, it is not terribly accurate but when a trend is established there is some useful information that can be gleaned from the models output. This computer outlook is run 4 times a day, every 6 hours. From one run to the next there can be big differences, so don't get caught up on the details. But, what it does show is a significant cooling trend going through November and into early December. The program that generates this output uses slightly different initial conditions to generate various solutions every time it runs. This is called an ensemble. Two runs below that were generated 1 day apart....


The most notable thing is the HUGE range of possibilities! Even the red line (ensemble mean filtered for intraseasonal conditions) changes from one run to the next. But I've been watching this for a while and the trend has definitely been for a colder solution.
I think the big players early on will be an unusually strong extension of the East Asian Jet, a developing sub-tropical jet and the position of semi-permanent low pressure areas over the north Pacific and near Hudson Bay. I'll be watching carefully to see how these features shift during the next 30 to 60 days.

I feel pretty confident that the balance of October will have normal to above normal temperatures. No widespread freeze is expected! However, once we get into November I expect there to be changes. I would surmise that the first widespread growing season ending freeze will occur that first week of November. The balance of November will likely be much colder with below normal temperatures on the average. There should be several opportunities for precipitation (snow too) so that the month should see normal to above normal precipitation.
Getting into December there should be wild swings with Arctic air outbreaks but evened out by dry and "mild" periods. By the first of December I should have a pretty good feel for the cycle that should be established so I will likely be updating this outlook periodically.
Beyond December and into the spring the only thing I can offer is that I would highly suspect that there will be several high impact winter storms across the high plains, maybe a few more than usual. A March blizzard seems to be a real possibility this year (greater than climatological chance).
Even though precipitation may be near to above normal across are area, that does not mean snowfall will be above normal. The reasoning is that some of the storms this year will likely produce freezing rain (or even rain) without producing much snow. Also keep in mind that EVEN if this map below was close to being correct, not every location in the shaded areas will have the predicted outcome due the variability with individual storms/systems.


No comments:
Post a Comment